Reports Generation: Unterschied zwischen den Versionen
Keine Bearbeitungszusammenfassung |
Keine Bearbeitungszusammenfassung |
||
| (3 dazwischenliegende Versionen von 2 Benutzern werden nicht angezeigt) | |||
| Zeile 8: | Zeile 8: | ||
The Mapping Report contains a detailed overview of all tags or mappings and their properties applied on a document. It may also include all untagged cells that have a table mapping and their detected values. Before Mapping Report generation, you may select or deselect the columns that you want to be included in the report. | The Mapping Report contains a detailed overview of all tags or mappings and their properties applied on a document. It may also include all untagged cells that have a table mapping and their detected values. Before Mapping Report generation, you may select or deselect the columns that you want to be included in the report. | ||
[[Datei:Mapping Report1.png|center| | [[Datei:Mapping Report1.png|center|1000px]] | ||
<br> | <br> | ||
[[Datei:Mapping Report2.png|center| | [[Datei:Mapping Report2.png|center|1500px]] | ||
==Text Block Report== | ==Text Block Report== | ||
| Zeile 17: | Zeile 17: | ||
The Text Block Report contains an overview of all text tags that have been applied to a report, it may included further details such as the continuation order and tag properties. Before Text Block Report generation, you may select or deselect the columns that you want to be included in the report. | The Text Block Report contains an overview of all text tags that have been applied to a report, it may included further details such as the continuation order and tag properties. Before Text Block Report generation, you may select or deselect the columns that you want to be included in the report. | ||
[[Datei:Text Block Report1.png|center| | [[Datei:Text Block Report1.png|center|1000px]] | ||
<br> | <br> | ||
[[Datei:Text Block Report2.png|center| | [[Datei:Text Block Report2.png|center|1500px]] | ||
==Calculation Report== | ==Calculation Report== | ||
| Zeile 28: | Zeile 28: | ||
To generate the Mapping report, click on Document → Calculation Report. | To generate the Mapping report, click on Document → Calculation Report. | ||
[[Datei:Calculation Report1.png|center| | [[Datei:Calculation Report1.png|center|1000px]] | ||
==Taxonomy Excel Report== | ==Taxonomy Excel Report== | ||
| Zeile 34: | Zeile 34: | ||
The Taxonomy Excel Report is a comprehensive list of the Presentation Linkbase, Calculation Linkbase, Definition Linkbase and Validations from the taxonomy that have been uploaded onto toolsxbrl. | The Taxonomy Excel Report is a comprehensive list of the Presentation Linkbase, Calculation Linkbase, Definition Linkbase and Validations from the taxonomy that have been uploaded onto toolsxbrl. | ||
[[Datei:Taxonomy Excel Report1.png|center| | [[Datei:Taxonomy Excel Report1.png|center|1500px]] | ||
== Siehe auch == | == Siehe auch == | ||
[[Datei:Navigation_hoch.svg|link=]] [[Using_toolsxbrl|Using toolsxbrl]] | [[Datei:Navigation_hoch.svg|link=]] [[Using_toolsxbrl|Using toolsxbrl]] <br> | ||
[[Datei:Navigation_rechts.svg|link=]] [[Getting_Started | Getting Started]] <br> | |||
[[Datei:Navigation_rechts.svg|link=]] [[Validation| Validation]] <br> | |||
[[Datei:Navigation_rechts.svg|link=]] [[XBRL_File_Generation| XBRL File Generation]] <br> | |||
{{WeitereInhalte}} | {{WeitereInhalte}} | ||
[[Kategorie:Word_Inhalte-veröffentlichen-toolsxbrl-Using_toolsxbrl]] | |||
Aktuelle Version vom 26. Oktober 2023, 13:45 Uhr
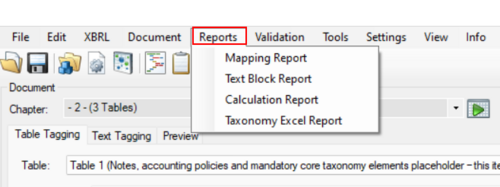
It is possible to generate four different kinds of report in toolsxbrl. Just click on Reports in the main Menu bar and select the desired report:
Mapping Report
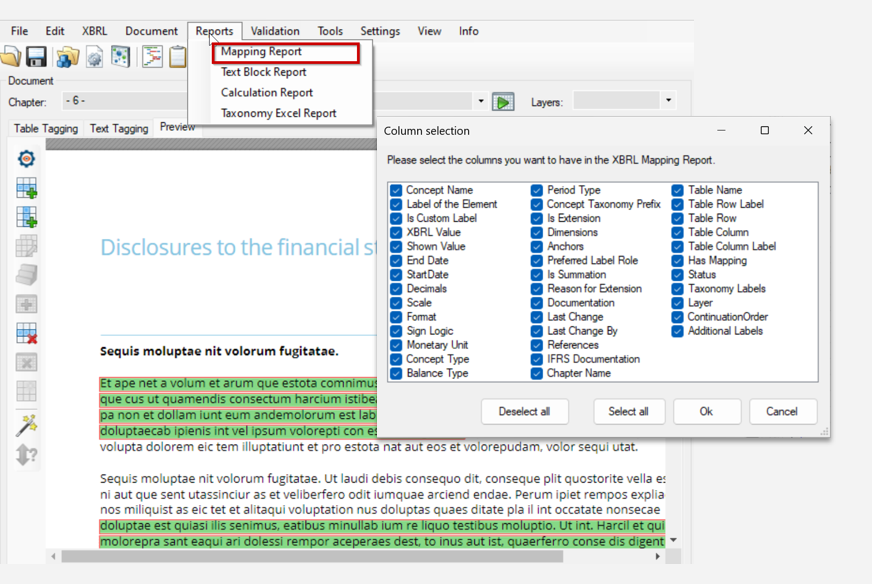
The Mapping Report contains a detailed overview of all tags or mappings and their properties applied on a document. It may also include all untagged cells that have a table mapping and their detected values. Before Mapping Report generation, you may select or deselect the columns that you want to be included in the report.
Text Block Report
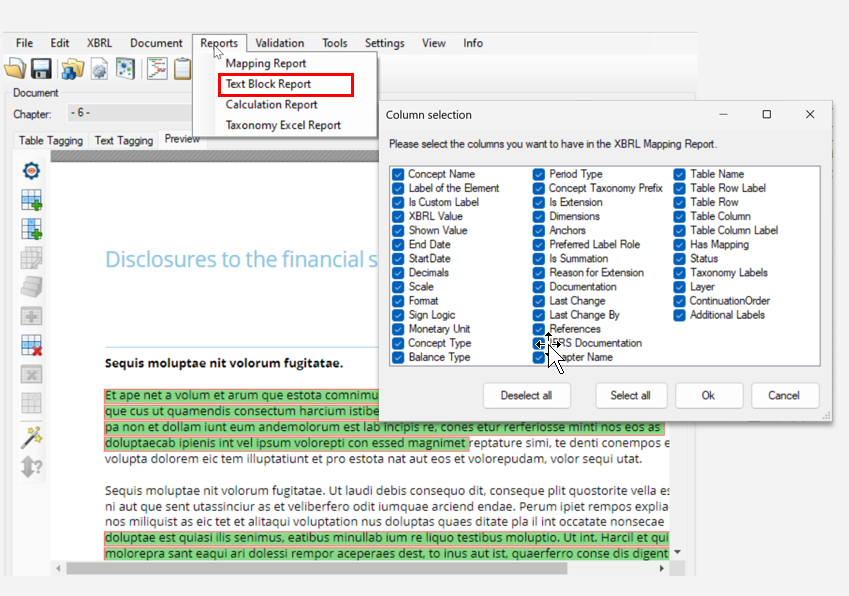
The Text Block Report contains an overview of all text tags that have been applied to a report, it may included further details such as the continuation order and tag properties. Before Text Block Report generation, you may select or deselect the columns that you want to be included in the report.
Calculation Report
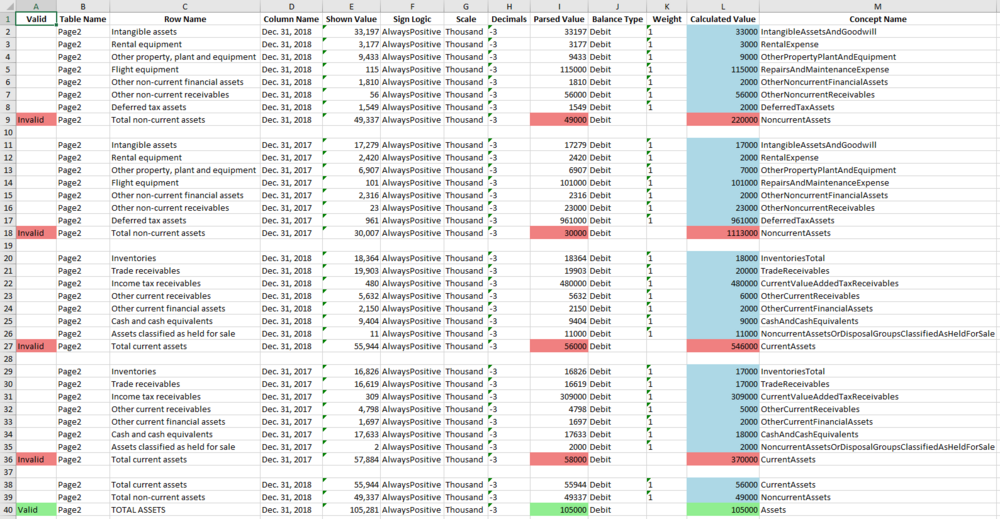
The calculation report gives an overview over all calculations in the report.
To generate the Mapping report, click on Document → Calculation Report.
Taxonomy Excel Report
The Taxonomy Excel Report is a comprehensive list of the Presentation Linkbase, Calculation Linkbase, Definition Linkbase and Validations from the taxonomy that have been uploaded onto toolsxbrl.
Siehe auch
![]() Using toolsxbrl
Using toolsxbrl
![]() Getting Started
Getting Started
![]() Validation
Validation
![]() XBRL File Generation
XBRL File Generation
Weitere Inhalte
→ Webseite
→ Kundenbereich
→ YouTube


