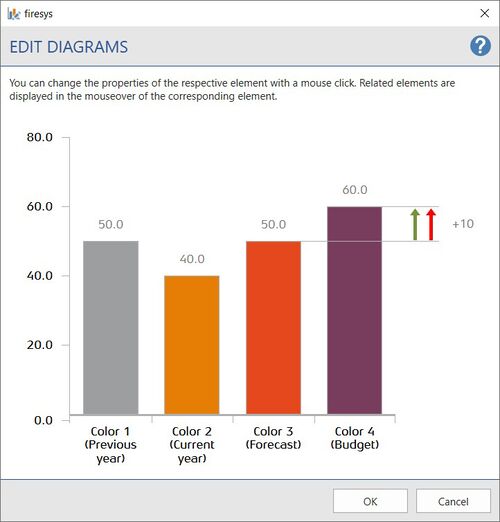
Edit diagrams
TO COME...
Passen Sie Diagramme Ihrem Corporate-Design an. Sie haben die Möglichkeit mithilfe von Formatvorlagen Ihre Diagramme zu verändern. Diese umfassen u.a. Achsen- und Datenbeschriftungen sowie das Einfärben der Diagramm-Elemente.
Funktionen
Anpassungen können an den folgenden Parametern vorgenommen werden:
Beschriftungen
Achsenbeschriftung
Wählen Sie hier die gewünschte Schriftfarbe sowie die gewünschte Schriftart aus.
Datenbeschriftung
Wählen Sie hier die gewünschte Schriftfarbe sowie die gewünschte Schriftart aus.
Use Case Diagrammelemente einfärben
Vorjahr
Aktuelles Jahr
Forecast
Budget
Positive Entwicklung
Negative Entwicklung
Video: Edit diagrams
This is how you design your diagrams in the corporate design:
-
Click on the “Layout manager“ button in the “*Premium Layout” tab in the “Premium Layout” group.
→ The Layout manager opens. -
In the Layout manager, select the colour scheme you want to adjust and click on the arrow symbol on the left.
-
Click on “Diagrams” underneath.
→ In the group “Diagrams” the “Edit” button is now selectable. -
Click on the “Edit” button.
→ The editing window opens. -
Select the elements you want to adjust.
-
The following things can be changed individually:
-
Font and colour of the axis labelling
-
Font and colour of the data caption
-
Colour of the individual data types (previous year, current year, forecast, budget)
-
Colour of the individual arrows (Positive development and Negative development)
Note: you can set custom colours via the RGB values as well as select them via the Office colour palette. Switch between these two options with the “User-defined colour” button in the lower left corner.
-
-
Click on "OK" to confirm your settings.
→ The settings made are transferred to the Layout manager. To apply the changes to the document, the layout must be applied (see Apply Colour scheme).
See also
![]() Overview_of_the_firesys_layout
Overview_of_the_firesys_layout
![]() Other_functions
Other_functions
![]() Edit_texts
Edit_texts
![]() Edit_tables
Edit_tables
